

Depending on where you live, property taxes can be a small inconvenience or a major burden. The average American household spends $2,869 on property taxes for their homes each year, according to the U.S. Census Bureau, and residents of the 26 states with vehicle property taxes shell out another $448.
Property taxes might appear to be a non-issue for the 35% of people who rent their homes, but that couldn’t be further from the truth. We all pay property taxes, whether directly or indirectly, as they impact the rent we pay as well as the finances of state and local governments.
But which states have the largest property tax load, and what should residents keep in mind when it comes to meeting and minimizing their tax obligations? In search of answers, we analyzed the 50 states and the District of Columbia in terms of real-estate and vehicle property taxes.

Cassandra Happe, WalletHub Analyst
Real-Estate Tax Ranking
Real-Estate Property Tax Rates by State
|
Rank |
State |
Effective Real-Estate Tax Rate |
Annual Taxes on $281.9K Home* |
State Median Home Value |
Annual Taxes on Home Priced at State Median Value |
|---|---|---|---|---|---|
| 1 | Hawaii | 0.27% | $757 | $764,800 | $2,054 |
| 2 | Alabama | 0.39% | $1,102 | $179,400 | $701 |
| 3 | Colorado | 0.49% | $1,378 | $465,900 | $2,278 |
| 4 | Nevada | 0.50% | $1,421 | $373,800 | $1,884 |
| 5 | South Carolina | 0.53% | $1,484 | $216,200 | $1,138 |
| 6 | Louisiana | 0.55% | $1,545 | $198,300 | $1,087 |
| 6 | Delaware | 0.55% | $1,546 | $305,200 | $1,674 |
| 6 | Utah | 0.55% | $1,546 | $408,500 | $2,241 |
| 6 | West Virginia | 0.55% | $1,564 | $145,800 | $809 |
| 10 | District of Columbia | 0.56% | $1,582 | $705,000 | $3,957 |
| 10 | Arizona | 0.56% | $1,567 | $321,400 | $1,786 |
| 10 | Idaho | 0.56% | $1,591 | $331,600 | $1,872 |
| 13 | Wyoming | 0.58% | $1,637 | $269,900 | $1,567 |
| 13 | Tennessee | 0.58% | $1,647 | $232,100 | $1,356 |
| 15 | Arkansas | 0.59% | $1,665 | $162,400 | $959 |
| 16 | California | 0.71% | $2,007 | $659,300 | $4,694 |
| 17 | North Carolina | 0.73% | $2,069 | $234,900 | $1,724 |
| 18 | New Mexico | 0.74% | $2,072 | $216,000 | $1,588 |
| 19 | Mississippi | 0.76% | $2,138 | $151,000 | $1,145 |
| 19 | Virginia | 0.76% | $2,150 | $339,800 | $2,591 |
| 21 | Indiana | 0.77% | $2,173 | $183,600 | $1,415 |
| 22 | Montana | 0.79% | $2,231 | $305,700 | $2,419 |
| 23 | Kentucky | 0.80% | $2,258 | $177,000 | $1,418 |
| 24 | Florida | 0.82% | $2,302 | $292,200 | $2,386 |
| 25 | Georgia | 0.83% | $2,348 | $245,900 | $2,048 |
| 26 | Oklahoma | 0.85% | $2,389 | $170,500 | $1,445 |
| 27 | Oregon | 0.86% | $2,421 | $423,100 | $3,633 |
| 28 | Washington | 0.88% | $2,476 | $473,400 | $4,158 |
| 29 | Missouri | 0.91% | $2,562 | $199,400 | $1,812 |
| 30 | North Dakota | 0.99% | $2,781 | $232,500 | $2,294 |
| 31 | Maryland | 1.02% | $2,875 | $380,500 | $3,880 |
| 32 | Minnesota | 1.05% | $2,949 | $286,800 | $3,000 |
| 33 | South Dakota | 1.14% | $3,206 | $219,500 | $2,496 |
| 34 | Massachusetts | 1.15% | $3,253 | $483,900 | $5,584 |
| 35 | Alaska | 1.16% | $3,268 | $318,000 | $3,687 |
| 36 | Maine | 1.17% | $3,288 | $244,800 | $2,855 |
| 37 | Kansas | 1.34% | $3,777 | $189,300 | $2,536 |
| 38 | Michigan | 1.35% | $3,796 | $201,100 | $2,708 |
| 39 | Rhode Island | 1.39% | $3,924 | $343,100 | $4,776 |
| 40 | Pennsylvania | 1.41% | $3,972 | $226,200 | $3,187 |
| 41 | Ohio | 1.43% | $4,026 | $183,300 | $2,618 |
| 42 | Iowa | 1.49% | $4,196 | $181,600 | $2,703 |
| 43 | Nebraska | 1.54% | $4,342 | $205,600 | $3,167 |
| 44 | Wisconsin | 1.59% | $4,471 | $231,400 | $3,670 |
| 45 | Texas | 1.63% | $4,586 | $238,000 | $3,872 |
| 46 | New York | 1.64% | $4,626 | $384,100 | $6,303 |
| 47 | Vermont | 1.78% | $5,028 | $272,400 | $4,859 |
| 48 | New Hampshire | 1.89% | $5,329 | $337,100 | $6,372 |
| 49 | Connecticut | 2.00% | $5,647 | $323,700 | $6,484 |
| 50 | Illinois | 2.11% | $5,960 | $239,100 | $5,055 |
| 51 | New Jersey | 2.33% | $6,563 | $401,400 | $9,345 |
*$281,900 is the median home value in the U.S. as of 2022, the year of the most recent available data.
Changes to Real-Estate Tax Rates Over Time
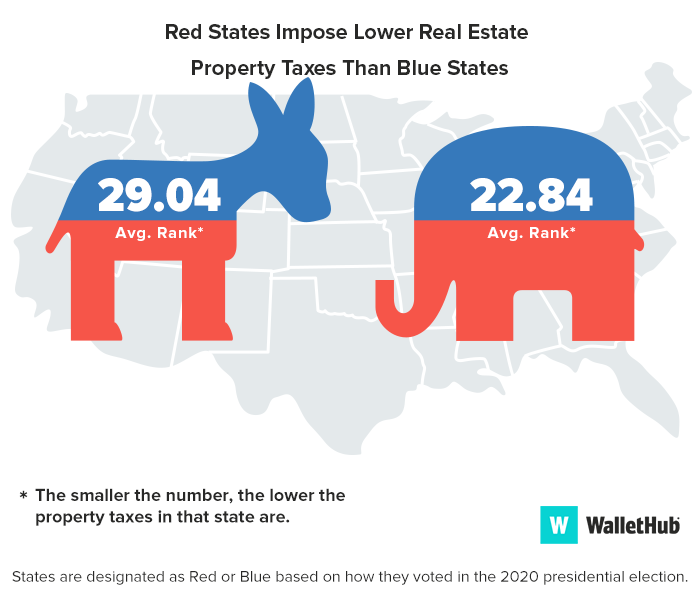
Red States vs Blue States
Vehicle Property Tax Ranking
Vehicle Property Tax Rates by State
|
Rank |
State |
Effective Vehicle Tax Rate |
Annual Taxes on $26K Car* |
|---|---|---|---|
| 1 | Alaska | 0.00% | $0 |
| 1 | Delaware | 0.00% | $0 |
| 1 | District of Columbia | 0.00% | $0 |
| 1 | Florida | 0.00% | $0 |
| 1 | Georgia | 0.00% | $0 |
| 1 | Hawaii | 0.00% | $0 |
| 1 | Idaho | 0.00% | $0 |
| 1 | Illinois | 0.00% | $0 |
| 1 | Maryland | 0.00% | $0 |
| 1 | New Jersey | 0.00% | $0 |
| 1 | New Mexico | 0.00% | $0 |
| 1 | New York | 0.00% | $0 |
| 1 | North Dakota | 0.00% | $0 |
| 1 | Ohio | 0.00% | $0 |
| 1 | Oklahoma | 0.00% | $0 |
| 1 | Oregon | 0.00% | $0 |
| 1 | Pennsylvania | 0.00% | $0 |
| 1 | Rhode Island | 0.00% | $0 |
| 1 | South Dakota | 0.00% | $0 |
| 1 | Tennessee | 0.00% | $0 |
| 1 | Texas | 0.00% | $0 |
| 1 | Utah | 0.00% | $0 |
| 1 | Vermont | 0.00% | $0 |
| 1 | Washington | 0.00% | $0 |
| 1 | Wisconsin | 0.00% | $0 |
| 26 | Louisiana | 0.10% | $26 |
| 27 | Michigan | 0.61% | $160 |
| 28 | California | 0.65% | $172 |
| 29 | Alabama | 0.70% | $185 |
| 30 | Iowa | 1.00% | $264 |
| 31 | Arkansas | 1.02% | $269 |
| 32 | North Carolina | 1.15% | $304 |
| 33 | Montana | 1.20% | $316 |
| 34 | Indiana | 1.32% | $350 |
| 35 | Kentucky | 1.45% | $382 |
| 36 | Minnesota | 1.58% | $416 |
| 37 | Nebraska | 1.59% | $420 |
| 38 | Arizona | 1.68% | $444 |
| 38 | West Virginia | 1.68% | $443 |
| 40 | Nevada | 1.77% | $469 |
| 41 | Colorado | 1.79% | $472 |
| 42 | New Hampshire | 1.80% | $476 |
| 42 | Wyoming | 1.80% | $476 |
| 44 | Kansas | 2.04% | $538 |
| 45 | Connecticut | 2.10% | $554 |
| 46 | Massachusetts | 2.25% | $594 |
| 47 | Maine | 2.40% | $634 |
| 48 | Missouri | 2.48% | $655 |
| 49 | South Carolina | 2.53% | $668 |
| 50 | Mississippi | 3.46% | $915 |
| 51 | Virginia | 3.97% | $1,050 |
*$26,420 is the value of a Toyota Camry LE four door Sedan (as of January 2024), the highest-selling car of 2023.
Ask the Experts
Property taxes are an extremely important issue since they impact all of our lives. But how should we incorporate them into our financial decision making? And how should policy makers across the U.S. approach them as well? For answers to those questions and more, we consulted a panel of tax and public-policy experts. You can check out their bios and responses to key questions below.
- Do people consider property taxes when deciding where to move? Should they?
- Should nonprofits pay property taxes?
- Should local tax policy be adjusted to rely more or less on property taxes versus other forms of taxation?
- Should more types of property be subject to property taxes? If yes, what types?
- Should certain groups of people be exempt from property taxes or be taxed at a lower rate?
Ask the Experts

Professor of Law, McGrath North Mullin & Kratz Chair in Business Law, Creighton University School of Law and Senior Affiliated Scholar, Institute for Economic Inquiry, Heider College of Business
Read More

J. Fish Smith Professor in Public Choice, Department of Economics and Finance Jon M. Huntsman School of Business – Utah State University
Read More

Professor Emerita – University of Oregon School of Law
Read More

Ph.D., CPA – Beights Research Fellow and Associate Professor of Taxation and Accounting, M.E. Rinker, Sr. Institute for Tax and Accountancy – Stetson University
Read More

Harry M. Walborsky Professor and Associate Dean for Business Law Programs, College of Law – Florida State University
Read More

Alva P. Loiselle Professor of Law – University of Connecticut, Law School
Read More
Methodology
In order to determine the states with the highest and lowest property taxes, WalletHub compared the 50 states and the District of Columbia by using U.S. Census Bureau data to determine real-estate property tax rates and applying assumptions based on national auto-sales data to determine vehicle property tax rates.
For real-estate property tax rates, we divided the “median real-estate tax payment” by the “median home price” in each state. We then used the resulting rates to obtain the dollar amount paid as real-estate tax on a house worth $281,900, the median value for a home in the U.S. as of 2022 according to the Census Bureau.
For vehicle property tax rates, we examined data for cities and counties making up at least 50 percent of a given state’s population and extrapolated this to the state level using weighted averages based on population size. For each state, we assumed all residents own the same vehicle: a Toyota Camry LE four-door sedan — 2023’s highest-selling car — valued at $26,420, as of January 2024.
Please note that Georgia formerly imposed vehicle property tax but replaced it in 2013 with a one-time tax imposed on a vehicle’s fair market value (FMV).
Sources: Data used to create this ranking were collected as of January 30, 2024 from the U.S. Census Bureau and each state’s Department of Motor Vehicles.
WalletHub experts are widely quoted. Contact our media team to schedule an interview.